Gantt Chart Customization
Make the Gantt chart work for your workflow by customizing visible columns, zoom levels, and other display options.Feature Spec Reference
Module 6.4 — ColumnsModule 6.3 — Zoom
Column Customization
Visible Columns
By default, the task list shows:- WBS, Name, Duration, Start, Finish, Progress %, Constraint Type
- Right-click a column header
- Select Show/Hide Columns
- Check/uncheck columns to show/hide
- Additional columns: Resource, Cost, Notes, Status, Activity ID
Column Width
Resize a column by:- Hover over the column border (between two column headers)
- Drag left/right to resize
- Double-click to auto-fit content
Column Order
Reorder columns by:- Click and drag a column header
- Drop it in the new position
- Column order is saved per project
Zoom Levels
Predefined Zoom Levels
Zoom Controls
- Zoom In (+ button): Zoom one level deeper
- Zoom Out (- button): Zoom one level wider
- Fit to Window: Fit entire project timeline on screen
Keyboard Shortcut
- Ctrl+Plus = Zoom in
- Ctrl+Minus = Zoom out
Scroll and Pan
- Horizontal scroll: Navigate left/right through the timeline
- Vertical scroll: Scroll up/down through task list
- Middle-click drag: Pan the timeline (click and drag to move)
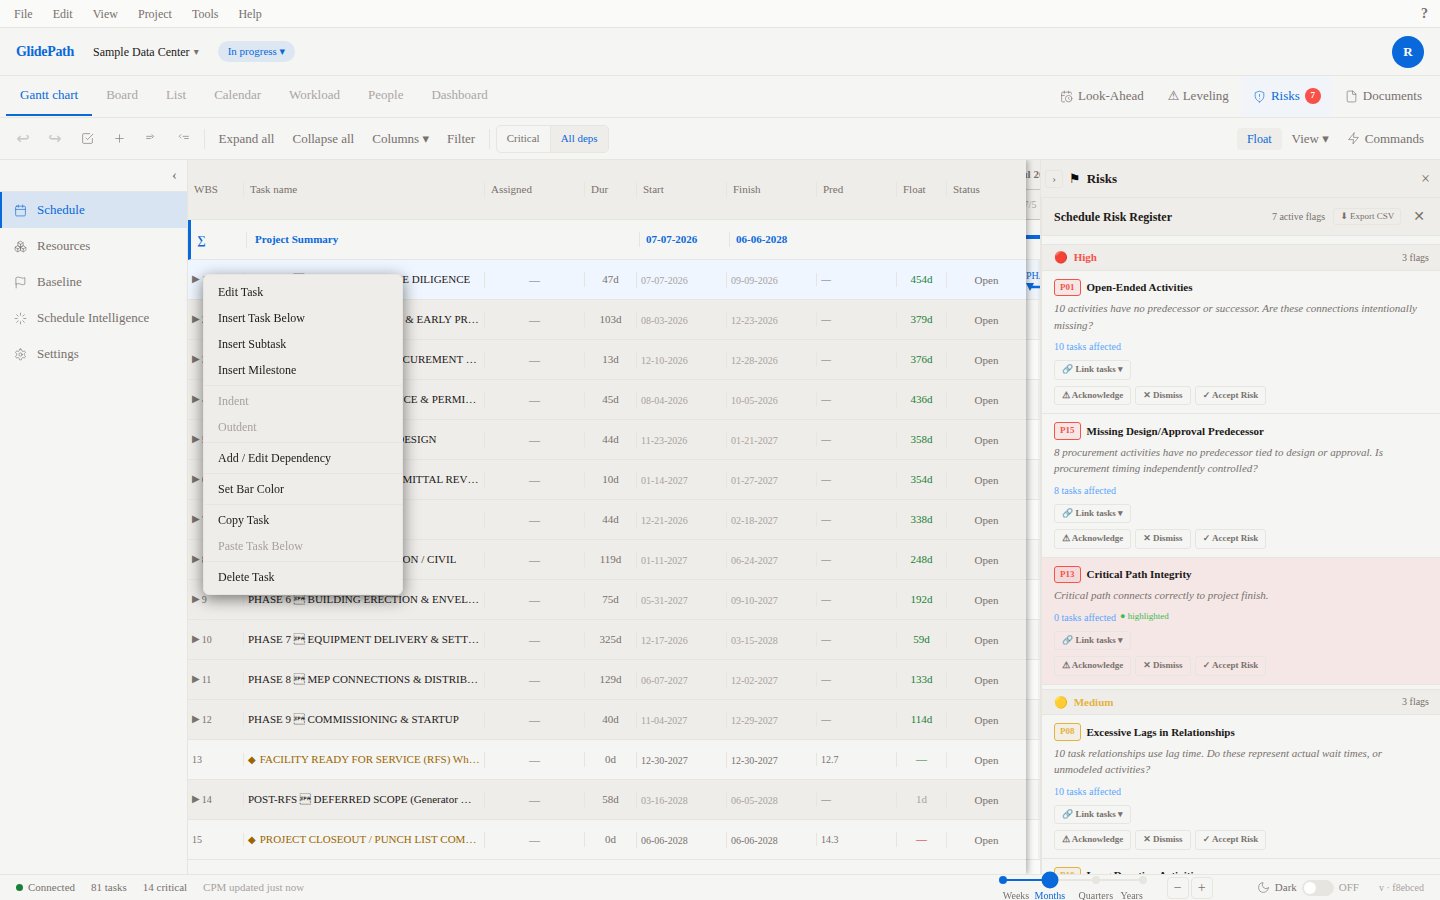
Screenshot
Saving Preferences
Your customization choices (columns shown, column widths, zoom level) are saved:- Per project
- Per user
- Persisted across sessions