Navigate the Interface
This guide introduces the GlidePath interface layout and shows you how to access the main views: Gantt Chart, Dashboard, Look-Ahead, and Risk Register.Feature Spec Reference
Module 6 — Gantt ViewModule 1.5 — Project Switcher
Main Application Layout
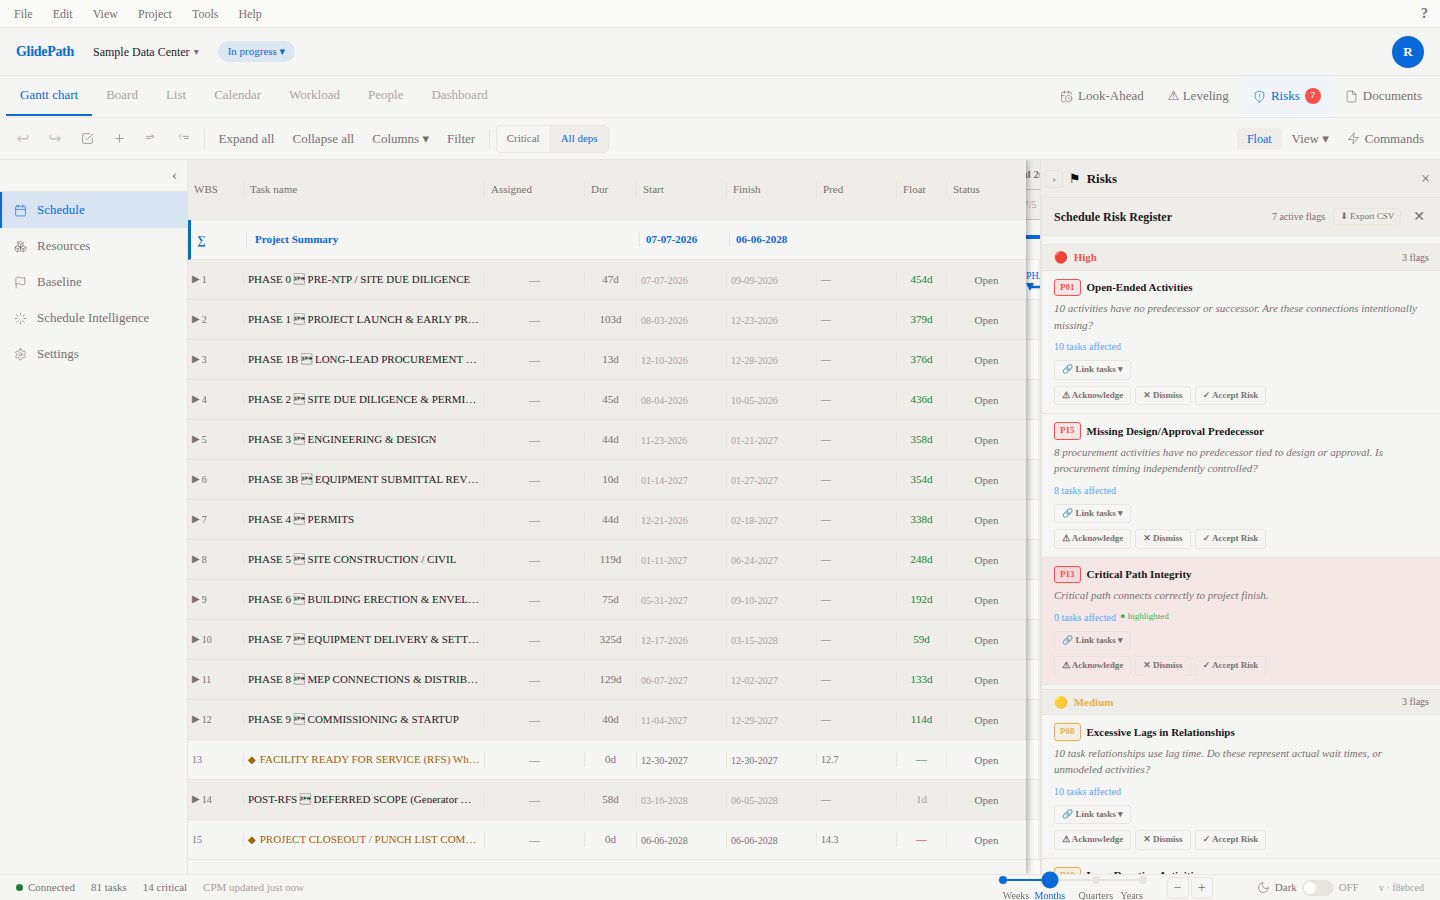
Top Header
- GlidePath Logo on the far left (click to return to home)
- Active Project Name in the center (shows which project you’re currently viewing)
- Project Switcher Dropdown next to the project name (click to switch between your projects)
- User Menu on the far right (account settings, logout, preferences)
Left Sidebar
The sidebar contains the main view tabs:- Gantt Chart (default) — Timeline visualization with tasks, dependencies, and critical path
- Dashboard — Overview widgets: project summary, task status, risk summary, look-ahead
- Look-Ahead — Next 2–4 weeks of upcoming tasks with alerts and conflicts
- Risk Register — Identify and track project risks
- Settings (gear icon) — Project settings and administration
Main Content Area
The center of the screen displays the current view (Gantt chart, dashboard, etc.). This is where you do most of your work.Toolbar (View-Dependent)
Depending on which view you’re in, the toolbar at the top of the main content area offers different controls:- + Add Task (Gantt Chart) — Create a new task
- Zoom Controls (Gantt Chart) — Zoom in/out or fit to window
- Filter Controls (Look-Ahead, Risk Register) — Filter by date range, status, etc.
The Four Main Views
1. Gantt Chart
The Gantt Chart is your primary scheduling view. It shows:- Task List (left side): Tasks with WBS numbering, names, duration, start/finish dates, progress %, and constraint type
- Timeline (right side): Horizontal bars representing task duration, dependency lines connecting related tasks, and the critical path highlighted in red
- Today Line: A vertical line marking today’s date
- Summary Tasks: Parent bars showing rollup of child task dates
- Milestones: Diamond-shaped bars (zero duration)
- Create and edit tasks
- Define and visualize dependencies
- See which tasks are critical
- Monitor progress with % complete
- Identify scheduling conflicts
2. Dashboard
The Dashboard provides a project snapshot with interactive widgets:- Project Summary: Duration, target completion date, budget, Schedule Performance Index (SPI), Cost Performance Index (CPI)
- Task Status: Count of tasks by status (on track, at risk, behind schedule)
- Risk Summary: Count of risks by priority/status
- Look-Ahead: Upcoming tasks for the next 2–4 weeks
- Financial Summary: Budgeted vs. actual costs, earned value
- Communicate project health to stakeholders
- Spot trends in task completion and risk status
- Monitor budget and schedule performance
3. Look-Ahead
The Look-Ahead Report shows upcoming work (next 2–4 weeks) with alerts for:- Tasks starting soon
- Tasks with dependencies coming due
- Resource conflicts or over-allocations
- High-risk work ahead
- Plan for the next sprint or reporting period
- Identify and resolve conflicts before they impact work
- Communicate with field teams what’s coming next
4. Risk Register
The Risk Register tracks identified project risks with:- Risk description and category
- Probability and impact rating
- Risk status (identified, mitigated, closed)
- Linked mitigation tasks
- Identify and document project risks early
- Assess risk severity
- Track risk mitigation progress
Project Switcher
If you manage multiple projects, use the Project Switcher dropdown to jump between them:- Click the project name in the header
- Select another project from the dropdown list
- GlidePath switches to that project’s Gantt view
Keyboard Shortcuts (Quick Reference)
For a complete list, see Keyboard Shortcuts Reference.
Next Steps
Now that you know the layout:- Create Your First Task — Start building your schedule
- Gantt Chart Overview — Learn the timeline visualization
- Create Dependencies — Link tasks together
Tip: Spend a few minutes exploring each view. Click a widget on the Dashboard to drill down into details.